BI Dashboard Solutions For The Real Estate Industry

Optimize your real estate investments and maximize your returns with our custom BI dashboard solutions for the real estate industry. Access and analyze your data from multiple sources in one place and get insights into your portfolio performance, tenant behavior, market trends, and opportunities. Partner with Al Rafay Consulting to get the best real estate dashboards.
Main Portfolio Banner 2

Invest with Insight: Get Data-Driven Deals With Our BI Dashboard Solutions For Real Estate

Our BI dashboard solutions are designed to help you make data-driven decisions and achieve your real estate goals. Our real estate dashboards are not just generic templates, but rather they are designed to be tailored to your specific real estate needs and challenges. Whether you are a real estate investor, developer, manager, broker, or agent, our BI dashboard solutions can help you: 

  • Monitor and manage your portfolio across different properties, locations, and asset classes 
  • Identify and reduce delinquency, vacancy, and turnover rates 
  • Find and compare the best deals for buying, selling, or leasing properties 
  • Track and optimize your tenant satisfaction, retention, and loyalty 
Introduction 2

Main Features of Our Real Estate Dashboard Solution

The real estate industry is facing many challenges and Al Rafay Consulting’s real estate dashboard solution is built to handle all of them. Our solution has six main features, each designed to address a specific aspect of your real estate business. These features are:

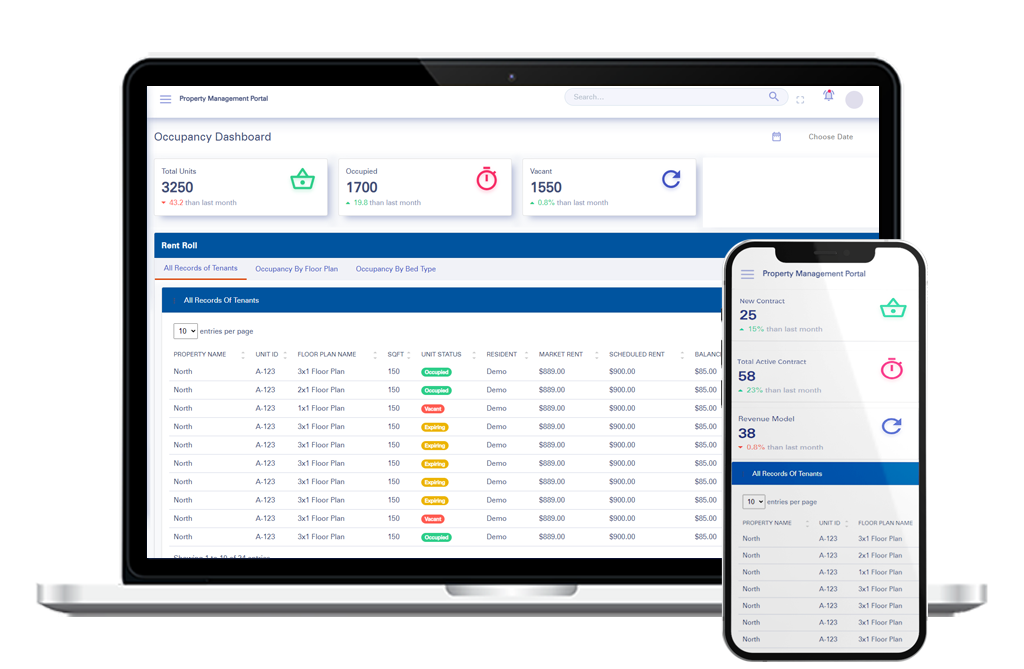
Tenant Listing Dashboard

Our BI dashboard solution has a tenant listing dashboard, which is especially helpful for real estate companies offering student housing. The tenant listing dashboard helps you to track and optimize your tenant management. This business intelligence dashboard can show you:
  • The total number and value of your current and prospective tenants
  • The tenant details, such as name, contact, lease, rent, and payment history of each tenant
  • The tenant performance, such as occupancy, turnover, retention, and satisfaction of each tenant
  • Portfolio Management Dashboard

    The portfolio management dashboard also allows you to drill down into the details of each property, unit, and tenant. You can see the individual performance, characteristics, and history of each entity. You can also compare and contrast different properties, units, and tenants to identify the best and worst performers, as well as the potential risks and opportunities.

    Capital Expenditure Dashboard

    The capital expenditure dashboard helps you to monitor and control your capital expenditure, which is the money you spend on acquiring, improving, or maintaining your properties. By getting data visualizations from this dashboard you can check:
  • The total amount and percentage of your capital expenditure
  • The capital expenditure breakdown by property, unit, and project
  • The capital expenditure trend over time and against the budget
  • The capital expenditure status, such as completed, in progress, or pending of each project
  • Delinquency Dashboard

    Our real estate software has a delinquency dashboard that helps you to manage and reduce your delinquency rate, which is the percentage of tenants who are late or default on their rent payments. The delinquency dashboard shows you:
  • The total amount and percentage of delinquent rent
  • The delinquency rate by property, unit, and tenant
  • The delinquency trend over time and against the target
  • The reasons and actions for delinquency
  • Building Listing Dashboard

    This feature of the real estate dashboard software allows the user to filter, sort, and search the listings by various criteria, such as price, size, location, and property type. You can also save, bookmark, and share your favorite listings with your team, partners, and clients.

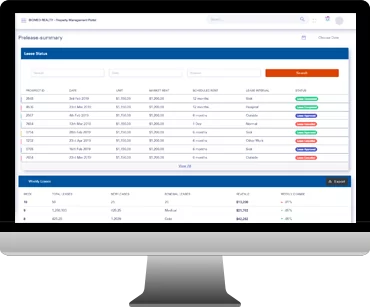
    Expiring Leases Dashboard

    With this, you can stay ahead of potential vacancies, negotiate renewals, and ensure a steady rental income stream to manage lease expirations proactively. It helps you forecast and plan your cash flow and revenue.

    Benefits of Using Our Real Estate Dashboard Solution

    By using our BI dashboard solution for real estate, you can enjoy the following benefits:
    sharepoint Dynamic Cross functional Team Proficient In Current Technologies And Tools
    Improved Decision-Making
    Our real estate dashboard solution helps you to improve your decision-making by providing you with actionable insights into your data. You can see the big picture and the small details of your real estate business. You can also discover the patterns, trends, and opportunities in your data.
    Improved Financial Performance
    Our analytics software helps C-level executives monitor financial metrics such as occupancy rates, rent collections, and expenses, helping them to identify areas where they can improve financial performance.
    Better Tenant Management
    The property management dashboards in the software help real estate owners and businesses understand and satisfy their tenants. You can understand your tenants’ needs, preferences, and behavior. By doing this companies can maintain a strong relationship with their tenants.
    Competitive Advantage
    Using business intelligence tools can help companies gain a competitive advantage in the industry. Our advanced analytical software helps you to gain a competitive advantage by giving you access to the latest technology and best practices. You can also benefit from our expertise and experience in real estate and BI.
    Cost-Effective BI Solution
    Our real estate dashboard solution is a cost-effective BI solution for your real estate business. You do not need to invest in expensive hardware, software, or licenses. Our solution is designed for businesses of all sizes so even startups can benefit from it.

    Benefits

    Technology

    Lorem ipsum dolor sit amet, consectetur adipiscing elit. Ut elit tellus, luctus nec ullamcorper mattis, pulvinar dapibus leo.

    Want to have centralized visibility over your
    portfolio performance?

    Keeping track of crucial information in the student housing industry is very challenging. With portfolio tracking and analytics solution, you can automatically track the portfolio performance with actionable insights, reports, and analytics.

    Frequently Asked Questions

    What are the best practices for creating a BI dashboard?
    The best practices for creating a BI dashboard include defining clear objectives, understanding the needs of business users, choosing relevant KPIs, ensuring a user-friendly dashboard design, and providing interactive visualization of data.
    How can business intelligence dashboards help in visualizing data?
    Business intelligence dashboards help in visualizing data by using graphs, charts, and other visual elements to represent complex data in a simplified manner. This allows stakeholders to easily interpret and analyze the information.
    What are some examples of BI dashboard visualization techniques?
    Examples of BI dashboard visualization techniques include using interactive graphs, drill-down capabilities, heat maps, geographical mapping, and trend analysis to present data in a compelling and insightful manner.
    What are the different types of dashboards used in business intelligence?
    The different types of dashboards used in business intelligence include operational dashboards for day-to-day monitoring, strategic dashboards for long-term planning, analytical dashboards for in-depth data analysis, and hybrid dashboards that combine features of the other types to address specific business needs.